Your Firewall Baseline Should Fail Builds
Most organizations can tell you whether their firewalls are healthy. Fewer can prove every allow rule is inspected, logged, owned, and still …
Lesson-Learned
Lab-Note
Panos
Python
Security engineer by day, homelab tinkerer by night. Building self-hosted infrastructure and documenting the journey.
Most organizations can tell you whether their firewalls are healthy. Fewer can prove every allow rule is inspected, logged, owned, and still …
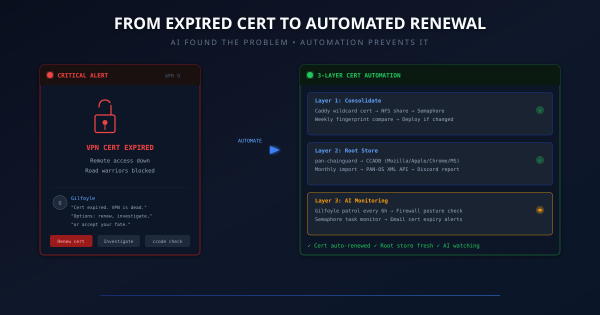
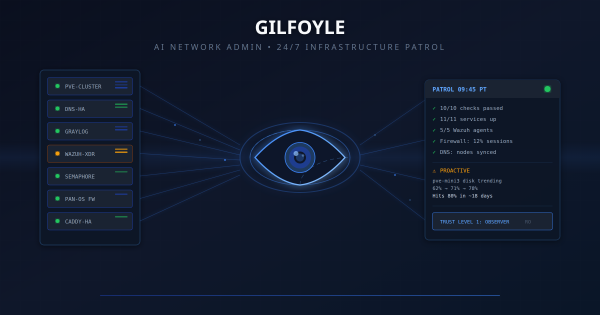
The Wake-Up Call # On April 9, Gilfoyle (my AI network admin) posted this at midnight: The cert flap resolved itself within hours. Gilfoyle …
The Problem: Nobody’s Watching at 3 AM # My homelab runs 47 guests across 4 Proxmox nodes, with HA pairs for DNS and reverse proxy, a …