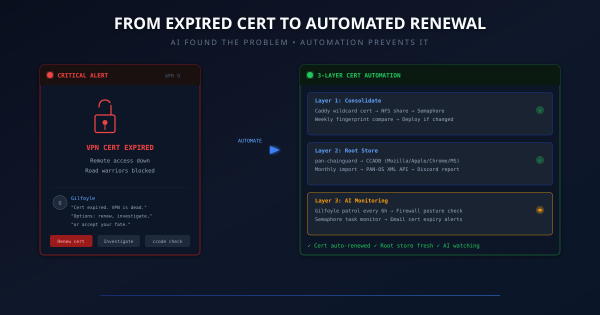
The Wake-Up Call # On April 9, Gilfoyle (my AI network admin) posted this at midnight:
The cert flap resolved itself within hours. Gilfoyle posted the recovery notice, and ccode closed the escalation. No lasting impact.
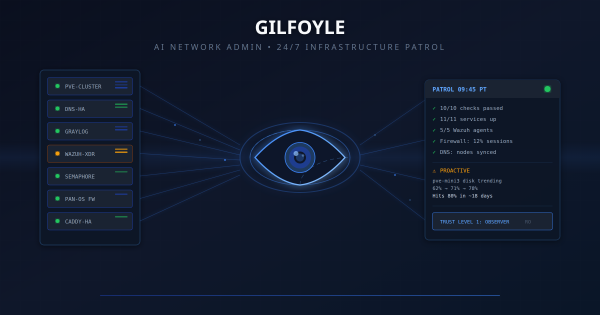
The Problem: Nobody’s Watching at 3 AM # My homelab runs 47 guests across 4 Proxmox nodes, with HA pairs for DNS and reverse proxy, a Wazuh XDR deployment, centralized logging in Graylog, and CI/CD automation through Semaphore. It’s a lot of infrastructure for one person to monitor.
I had alerts. Grafana fires when RAM hits 75%. Wazuh flags suspicious file changes. n8n emails me when workflows fail. But alerts are reactive. They tell you something broke. They don’t tell you something is about to break.
The Problem: Six Interfaces for One Question # “Is anything broken in my homelab?”
Answering that question used to mean: SSH into Proxmox to check guest status. Curl the Pi-hole API for DNS health. Open Grafana to scan Prometheus alerts. Check Graylog for error spikes. Look at Semaphore for failed automation runs. Glance at Caddy logs for 502s.